
What does good look like for this team, at companies like ours?
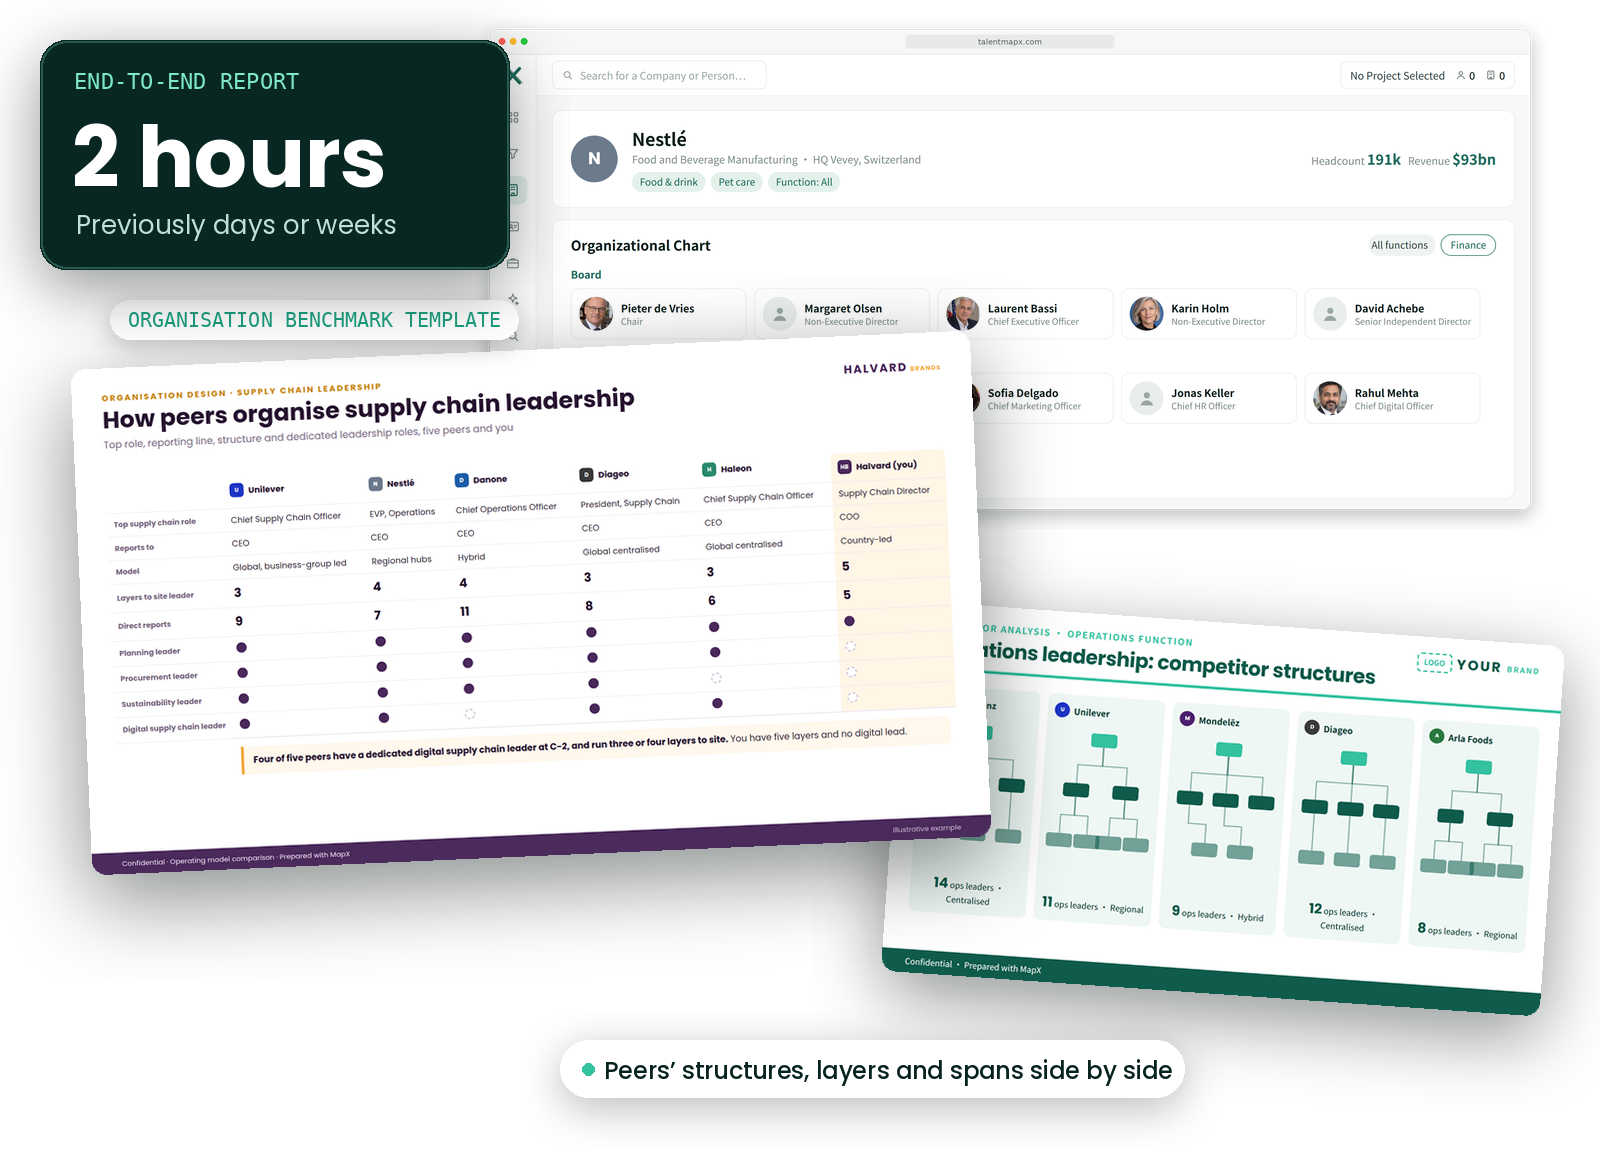
Compare how peers structure a function: the top role, reporting lines, layers, spans and the specialist roles they have created. Design with evidence from the companies getting it right.
THE PROBLEM
Internal data shows the structure you have, not your options
Redesigning from your own org chart tends to evolve what already exists. Consultancy benchmarks help, but they are expensive, slow and hard to repeat each time the design changes.
Organisation design benchmarking starts from how other companies actually organise the same function. MapX reads the leadership structures of the peers you choose, counts layers, spans and specialist roles, and lines them up beside yours, so a proposed structure can be argued from evidence rather than preference.
Your HR system describes the structure you already run.
Benchmarking surveys report averages, not the companies you compare yourself with.
A consultancy study answers once, for one design question.
MapX compares the peers you name, role by role, and can be rerun as the design evolves.
Questions it answers
Who leads this function at our peers, and who do they report to? See the named leader of each function at every company you select, their scope and their reporting line, so you can compare seniority as well as structure.
How many layers and direct reports do peers run? Spans and layers are counted the same way at every company, which turns an argument about structure into a comparison you can show the board.
Which specialist leadership roles do peers have that we don’t? MapX classifies 420 specialisms across 16 functions, so new or emerging roles show up long before they appear in a survey.
Centralised, regional or hybrid: which model do peers use? The shape of each leadership team shows how the function is run, and which model the companies growing fastest have chosen.
-

Who leads it
Who leads this function at our peers, and who do they report to?
-

Layers and spans
How many layers and direct reports do peers run?
-

Specialist roles
Which specialist leadership roles do peers have that we don’t?
-

Which model
Centralised, regional or hybrid: which model do peers use?
The ingredients behind the answer
Every company and career in MapX is classified the same way. Combine the ingredients and the answer gets sharper. Polaris does this for every search.
For an organisation design benchmark, you pick the function and the peers, and MapX maps each leadership team by role, level and reporting line, so structures can be compared on the same terms.
-

Companies
Peer sets by industry, company type, scale and business model.
-

Functions
Which specialist leadership roles each peer has.
-

Seniority
Layers and spans from the top role down.
-

Locations
Central, regional or hybrid models.

What the output looks like
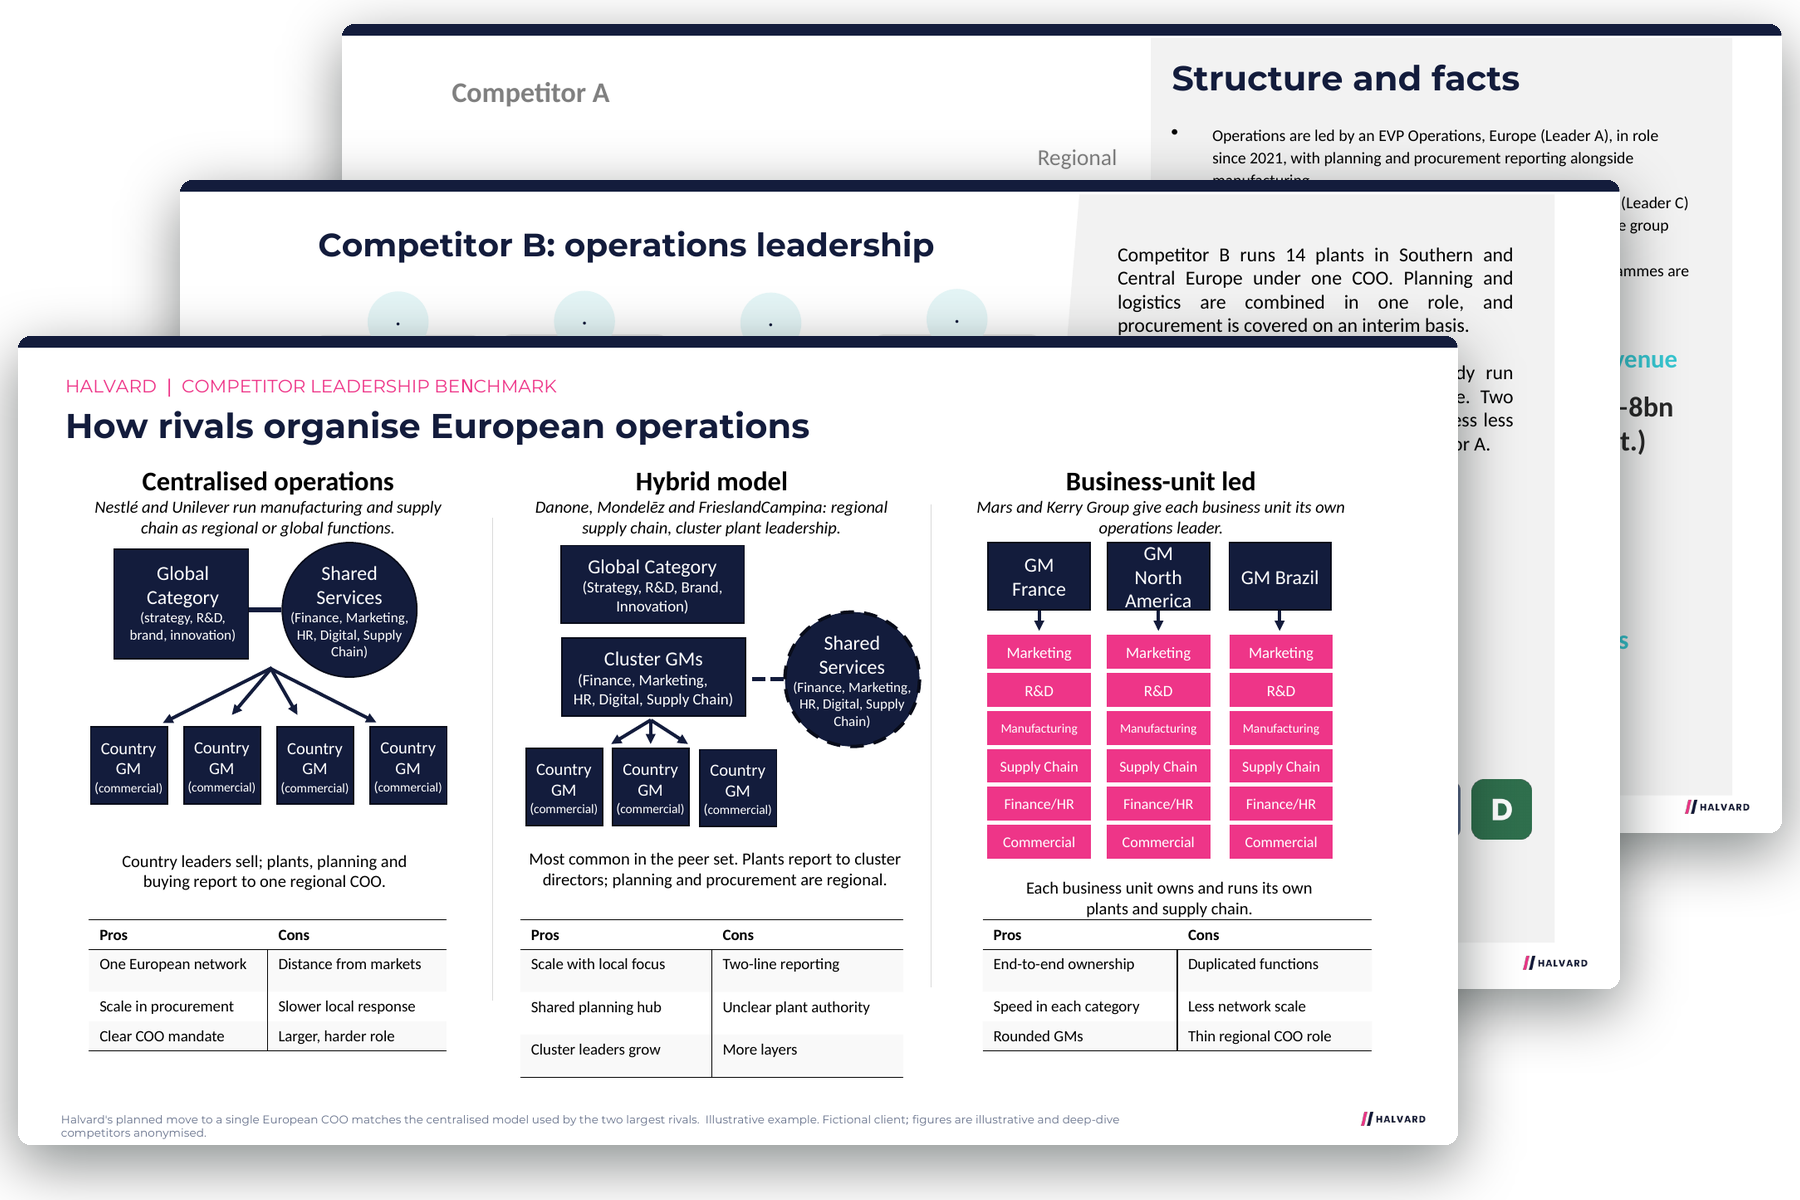
How rivals organise the function, with the pros and cons of each model, then the structure, spans and reporting lines at individual peers. Shown in a client’s brand, with illustrative data and anonymised leaders.
How peers organise the function: centralised, regional or hybrid
Layers, spans and reporting lines at each company
The specialist leadership roles peers have created
HR business partners and organisation design teams use it to test a proposed structure against the market before it goes to the executive team, and to rerun the comparison as the design changes.
22m+
Senior leaders profiled, worldwide
2m+
Companies classified, public or private
420
Specialisms across 16 functions
11
Languages read in job titles
Questions teams ask
What teams ask before they start.
Can we choose the peers?
Yes. Choose peers by industry, business model or scale, or mix sectors to learn from the companies getting it right.
Which functions can be benchmarked?
Any of the 16 functions MapX classifies, from operations and supply chain to finance, digital, commercial and HR, down to 420 specialisms.
Does it replace consultants?
For the external evidence, often. Many teams run the benchmark themselves and bring in 6 Group’s experts for the design work itself.
How are spans and layers counted?
The same way at every company, from the function head down, using classified seniority levels rather than job titles, so the comparison holds across companies.
Are the reports editable?
Yes. Reports come as editable PowerPoint in your brand, so the benchmark can go straight into a design proposal.
Can we see named leaders?
Yes. Every structure links to the leaders behind it, so you can see who holds each role at each peer.
How do we get started?
Two calls: one to set up your report library in your brand, and one to run a first benchmark together on the function you are redesigning.
How often does the data change?
MapX is refreshed continuously, so each benchmark reflects peers’ structures at the time you run it.
Benchmark the structure of one function
Book a 45-minute demo. Bring a live search or a talent question and we'll show you what MapX finds, and what you'd get. Or start with the free sample pack: three finished reports in a client's brand.